Sale!

Nyquist Plot

Original price was: ₹92.00.Current price is: ₹27.00.

A Nyquist plot is a graphical representation used in control systems to analyze the frequency response and stability of a system. It maps the trajectory of the system’s frequency response as it traverses the complex plane, typically by plotting the real and imaginary parts of the system’s transfer function as a function of frequency. This plot is constructed by evaluating the transfer function along the imaginary axis and around the unit circle in the complex plane.


Download Sample

Category:

Description

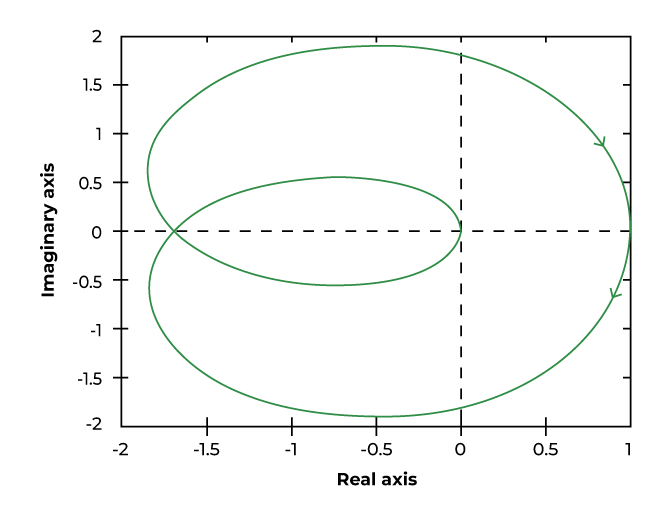
Nyquist plots provide valuable insights into system stability by indicating the number of encirclements of the critical point (-1, 0) in the complex plane, known as the Nyquist criterion. If the plot encircles the critical point in a counterclockwise direction, the system is stable; otherwise, it is unstable. Nyquist plots are essential tools for engineers to design and analyze control systems, particularly in assessing stability margins and predicting system behavior under various conditions.

Reviews

There are no reviews yet.

Only logged in customers who have purchased this product may leave a review.