Sale!

Polar Plots

Original price was: ₹88.00.Current price is: ₹29.00.

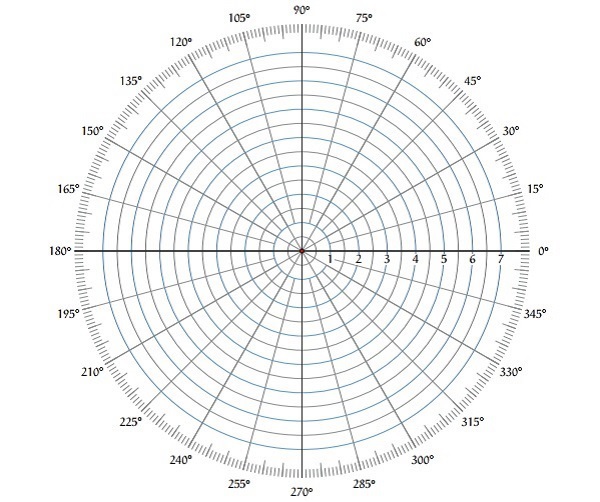
Polar plots in control systems are graphical representations that illustrate the frequency response of a system in the complex plane. Unlike Nyquist plots, which specifically depict the gain and phase of a system’s transfer function as it traverses the unit circle, polar plots focus on showcasing the locus of the system’s magnitude and phase across a range of frequencies. The magnitude is represented by the distance from the origin, while the phase is denoted by the angle relative to a reference axis.


Download Sample

Category:

Description

Polar plots provide a comprehensive visualization of how a system responds to varying frequencies, aiding engineers in analyzing stability, bandwidth, and gain and phase margins. They are particularly useful in design processes, allowing engineers to optimize system performance by visualizing and understanding the complex relationship between frequency and response characteristics.

Reviews

There are no reviews yet.

Only logged in customers who have purchased this product may leave a review.